Due to climate change, coastal and polder areas are increasingly confronted with salinisation. VITO supports the monitoring and mapping of salinisation by using sensor data. We combine the sensor measurements with modelling and machine learning to predict the salinisation dynamics. This enables smart management and mitigation of salinisation and its potential adverse effects.
- Advice and support in the development of a sensor network to monitor salinisation
- Real-time monitoring of salinisation
- Hydrological models with artificial intelligence to predict salinisation
- Use of sensors to evaluate salinity conditions during periods of drought
Drought
The coastal and polder area is naturally saline. In this zone fresh, brakish and salt water conditions occur. Due to drought and low groundwater levels, the salinity in soil, groundwater and surface water has been steadily increasing in recent years. This causes salinisation and has numerous adverse effects.
High salinity reduces the usability of that water for both drinking water production and agricultural use. The use of saline water in irrigation of agricultural land makes the soil infertile and livestock can fall ill or die from drinking water of elevated salinity.
Companies that use surface water as process water or for cooling also face problems due to salinisation. Their infrastructure degrades faster due to corrosion.
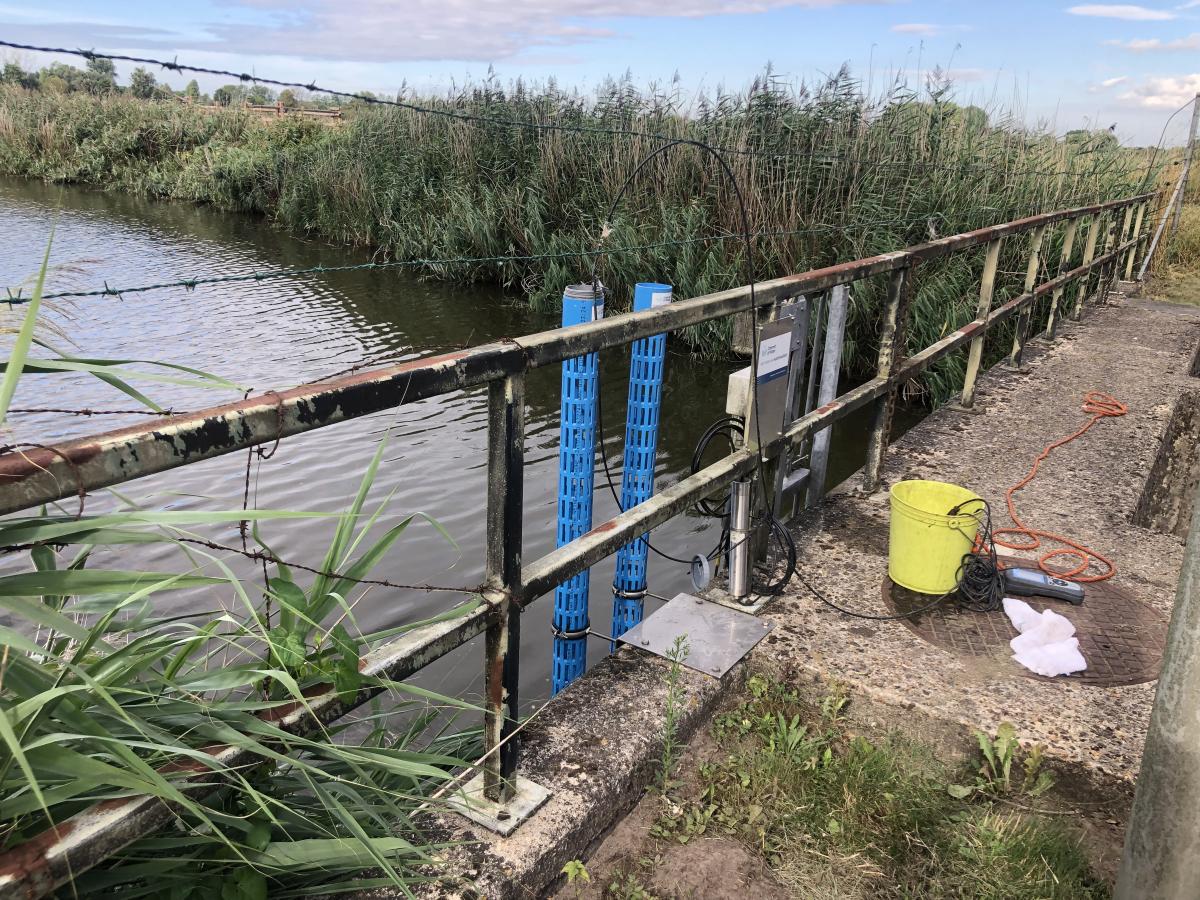
Sensor network
VITO offers advice and support for the development of a sensor network for real-time salinisation monitoring. The sensors measure the electrical conductivity in the water, which is considered a reliable proxy for salinity. This type of sensors can be placed in streams, rivers and canals, but also in groundwater wells and at wastewater treatment plants.
The data flows from the sensor network show the evolution of salinisation in time and space. This enables monitoring, evaluation and, if necessary, alarms.
Artificial intelligence
VITO's innovative algorithms and hydrological models open the way to predicting salinity.
Among other things, we use machine learning techniques to predict the expected salinity and we link the data coming from our sensors to our knowledge of physical characteristics such as soil type, river width, proximity to the sea and tides.
The results can be presented to stakeholders in a clear and insightful way by means of dashboard that show the current situation and forecasts for the next few days. This will enable them to intervene in time and to limit or even prevent possible harmful effects with targeted measures.
We are currently working on further processing of sensor data in combination with new and historical lab analysis data of grab samples. This allows us to even better determine the status and trend of salinisation based on measured salinity. That way, we can interpret incoming sensor data even more broadly.
Mapping the entire watercourse
By enriching sensor data with other datasets and bringing them together in algorithms and models, we can not only evaluate and predict the status at the specific sensor locations, but also estimate the situation at intermediate river sections.
When we integrate sensor measurements at various locations along a watercourse in time and space, we can unravel the dynamics and patterns. This allows us to better understand, among other things, various causes of changes in water quality.
