Picture above: The Grand Canyon (AZ, USA), where the Colorado river network revealed many deep hidden layers.
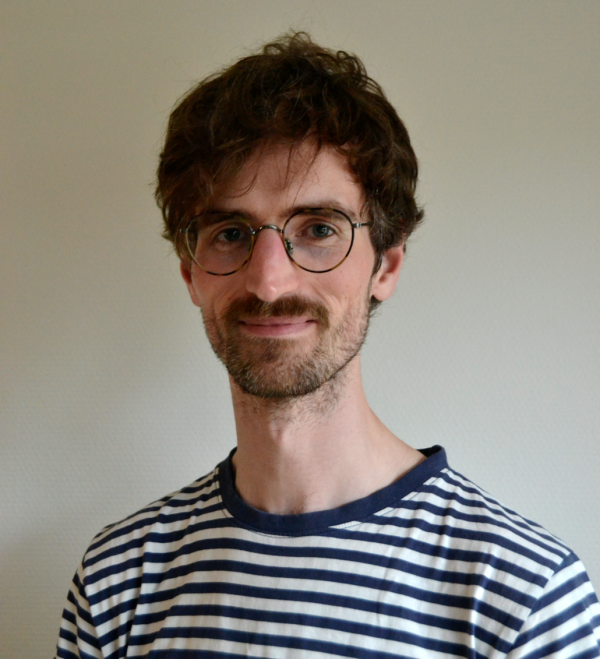
Maarten Van Loo (1990) is a Data Scientist at VITO Water.
He holds a master in Artificial Intelligence and Geography. During his PhD, Maarten adapted the FAO’s AquaCrop agronomical model to calculate the effects of human impact on crop yield and human carrying capacity in the past.
Maarten worked as a Data Scientist at Locus/Geo Solutions. Here he developed most of his IT skills, working on a project where predictions were made on truck driver drowsiness levels based on high frequency steering wheel patterns.
At VITO Maarten is responsible for a variety of modelling and data science projects: decentral urban water network modelling, machine learning algorithms and pipelines for water quantity & quality, Geo-IT related programming/analysis projects, etc. Maarten often forges a bridge between VITO's research and IT oriented employees, having both worked intensively in an IT and scientific context. Maarten is continuously on the lookout for ways to improve current workflows in more efficient ways, both by coding and automatization but also by thinking deeply about project management and digital etiquette.
Water, the new gold
Water is the new gold. Increasing droughts make that the supply of water can’t be always guaranteed. Investments are needed to the water system in the EU and Flanders to overcome potential societal, economic, and environmental damage. In 2022, the Flemish government provided €0.5 billion to combat droughts alone. In Flanders, 1 in 4 works in a water intensive sector. The 15 sectors that use the most water, are directly responsible for almost 30% of total employment in Flanders, and the share of these water-intensive sectors in the gross added value of the Flemish economy amounts to a whopping 80 billion euros . This to illustrate that being able to provide enough water at the right quality is becoming increasingly crucial, not only for companies traditionally associated with water (e.g. drinking and treatment utilities), but for the whole economy.
The other coin of this (gold) medal, is the abundance of water in a short period of time. In July 2021, Parts of Western Europe (including the Vesdre Valley, Wallonia) were struck by a so-called water bomb: an unusual amount of rainfall in a short period of time that causes severe flooding. The event took the lives of 243 people, and severely impacted many more. Property damage was estimated up to €54 billion (2021 Euro). The frequency of such extreme rain events is expected to increase and can be linked to the warming of earth’s water bodies, the weakening of the jet stream, and ultimately the blockage of weather systems at a single place. It’s easy to understand, that having a tool that would be able to predict future water quantity and quality would be a crucial ally in protecting our society from both water shortages & overabundances.
Sensors, data, models: action!
Currently, the water landscape is undergoing a digital transformation. Data are being generated and collected at larger scale due to the increasing use of sensor technology and there is growing interest for operational use of predictive models for decision making: predicting the salinity of the incoming water at a water production facility, to pick the ideal moment in time to start water production; or balancing a wastewater treatment plant in such a way, that energy levels can be kept as low as possible to deal with a predicted peak in arriving wastewater.
These predictive models don’t come without struggle. For a start, the sensors (and data) that feed these models, are tiny electronic devices that are cast into rather harsh environments: rapidly flowing rivers, water bodies full of algae looking for a place to settle, or even sewers filled with sludge. It shouldn’t come as a surprise, that these sensors often show signs of drifting, or even have prolonged periods of outage. On the other hand, many of our water courses are largely affected by human activities and interventions. Hydraulic structures are installed to control water levels and flows. Riverbeds are moved, adjusted or straightened. Water is abstracted and used for e.g. drinking water production and irrigation. Point discharges (e.g. wastewater, effluent, sewer overflows) and diffuse sources (e.g. runoff, agriculture, salinity intrusion) alter the water quality along the river trajectory. This results in highly variable river hydraulics and water quality with location specific patterns and characteristics. Models that try to capture all of these elements can become rather complex and will require many sophisticated mathematical computations. On the other hand, data describing all these processes might not be readily available.
Models?
A model is a simplified representation of a real-world system, used to understand, simulate, or predict its behaviour. In essence, models take input data, process it through defined rules or equations, and produce an output that approximates reality. For example, weather forecasts and economic predictions are generated using models. In our case, we are looking at water quantity & quality predictions.
There are different types of models. Process-based models rely on established scientific principles to simulate natural systems, like groundwater flow or pollutant dispersion. Data-driven models use historical data and machine learning techniques to identify patterns and predict outcomes, such as water quality predictions based on past observations. Hybrid models combine both approaches, leveraging physical processes and data-driven insights for better accuracy.
However, over the years, many examples have popped up showing that artificial intelligence (AI) was able to come with excellent predictions of various spatio-temporal phenomena. They do not require exact formulations of all processes that can influence such phenomena, but they merely need to be fed with a lot of data. Although there are some challenges to the availability of water data, researchers over the world have taken up to task to try and build such data-driven models in the water landscape. And so did we at VITO!
Teaching the machine
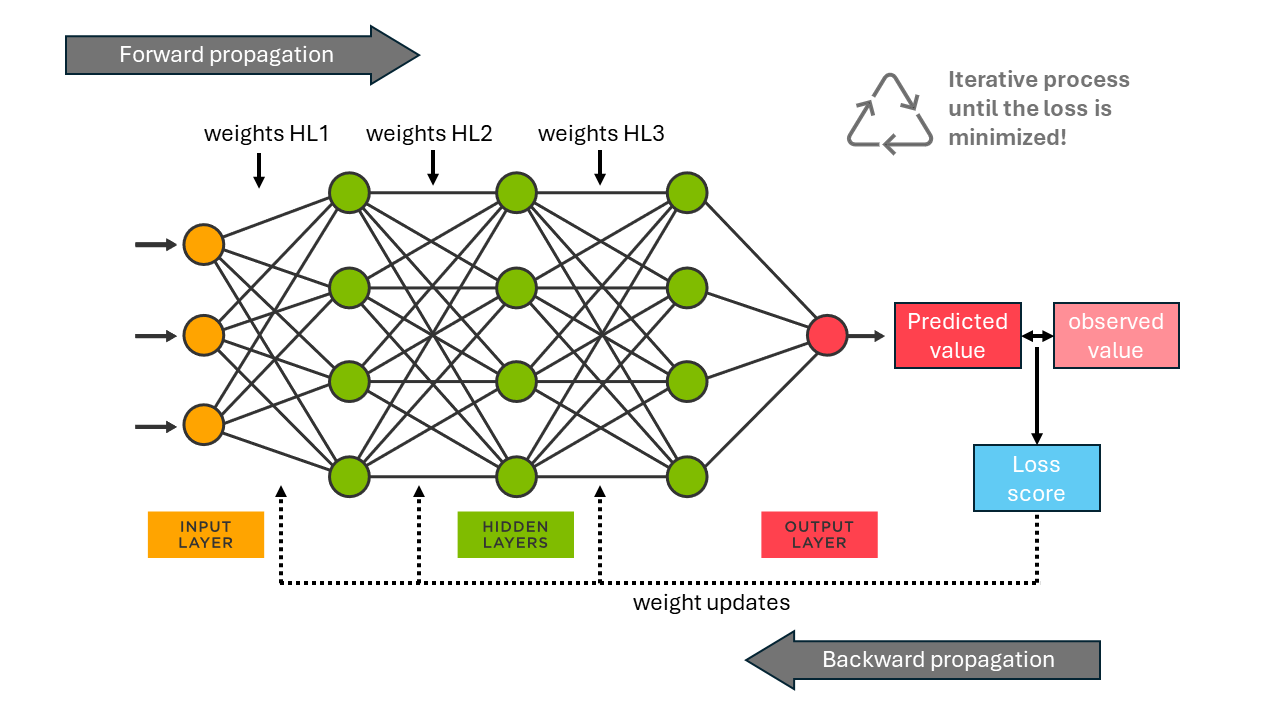
To make predictions of water quantity and quality, we take a look at a specific branch of AI, called machine learning. A machine learning model like an artificial neural network, can be shown a lot of data, say for example time series observations of water quality, rainfall, temperature and soil moisture. In a machine learning model you define, roughly speaking, 2 elements. First, you construct an array of mathematical operators with weights. Secondly you define the target for which the model needs to make predictions, e.g. the water quality 12 hours in the future. The model is then shown pieces of observed data (the input data): the target water quality in 12 hours, and the water quality, rainfall, temperature and soil moisture that preceded this water quality observation in the previous 24 hours. The model will make an initial guess at the weights. These weights will result in a translation from input data to a prediction (on the target data). This loop is also called the Forward propagation. If the prediction is off (comparing the predicted value with the observed value, also called the loss), the weights are changed slightly, and a new attempt is made (Backward propagation). This process of “teaching” a machine learning model (also called training) is repeated until the model arrives at a state in which it can successfully predict the future. The weights of the models are stored, and researchers can now use this model to make predictions on newly seen data! If this doesn’t work immediately (spoiler: it often doesn't), the researcher goes back to the drawing board and might need to define a new array of mathematical operators or select additional input data to feed the model. The options are endless but go beyond the scope of this blog post. The basic principles are visualized in Figure 1.

The Yser river: Forecast of river salinity for drinking water intake optimization
The Yser river stretches 78km through France and Belgium, ending up in the North Sea at Nieuwpoort. The Yser passes the Ganzepoot sluices complex just before entering the sea, where 6 different waterways come together. They manage the entering of ships, migration of fish and de-water the Polders from excess water. During summer, salt often migrates through the sluice land inward, upstream into the Yser river.
The Yser river is used as a raw water source for drinking water production by De Watergroep. Increasing salinity levels in the raw water can cause difficulties for drinking water production. Specific treatment for removal of salts is required and desalinization through reverse osmosis consumes a lot of energy.
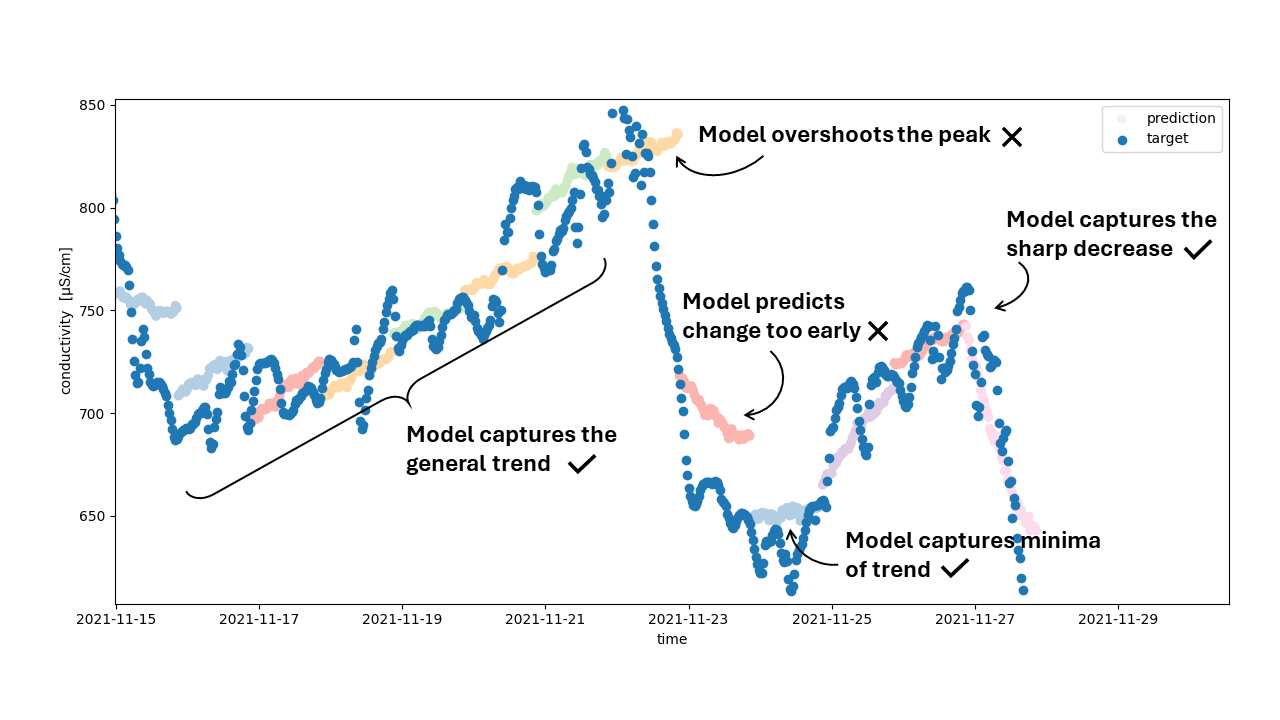
An artificial neural network (ANN) was constructed by VITO to forecast salinity in the Yser river. Sensor data along the Yser on electrical conductivity (EC) were used to train the model, along with data on rainfall, discharge and water heights. The ANN looks at the past 24 hours of observations and tries to predict the next 24 hours at the same time, so that a drinking water utility could anticipate on this.
Figure 2 shows a slice of the model results. The blue dots show the observations, while the coloured dots each show an array of 24-hour predictions. It is these set of forecasts that can be of use to decide when to abstract water from the river for drinking water production. The model gets the general trends right, but there are still some errors. For example, the model doesn’t always detect a change in trend at the right time. For example, the sharp decrease in conductivity, around the 23rd of November 2021, was not predicted. Instead, the model is lazy and just continues the trend it’s predicted. Only when new data are fed into the model, and the model “sees” the decrease in conductivity, it corrects itself.

The Tilburg wastewater treatment plant: Forecast of wastewater flow for treatment optimization
The Tilburg wastewater treatment plant (WWTP) in the Netherlands cleans wastewater from the municipalities of Tilburg, Udenhout, Berkel-Enschot en Biezenmortel, at a rate of around 60 000m³ per day. After treating the wastewater, the cleaned water is discharged into the Zandlij river.
The incoming wastewater, also called influent, is an important variable for operation and optimization of the WWTP. Knowing when and how much influent is to be expected can help the operators of the plant and helps saving resources and energy costs. Excessive flow rates may overload the treatment systems, causing the release of untreated or partially treated wastewater. Conversely, low flow rates can lead to the sludge spend too much time in the system which might cause sedimentation problems and odour issues. On the other hand, wrongly anticipating on water quality can lead to inefficiencies in the treatment processes, as they are designed to operate within certain ranges of pollutant concentrations.
For the WWTP influent prediction model, we chose a Long short-term memory (LSTM) architecture. It’s a special type of neural network designed to recognise patterns in sequences of data, like words in a sentence or time series data. It’s able to remember the important information and forget unnecessary details. This is different from the architecture used in the Yser case. Like said before, researchers have a lot of options for their “array of mathematical operators” that will be used to train the machine learning model.
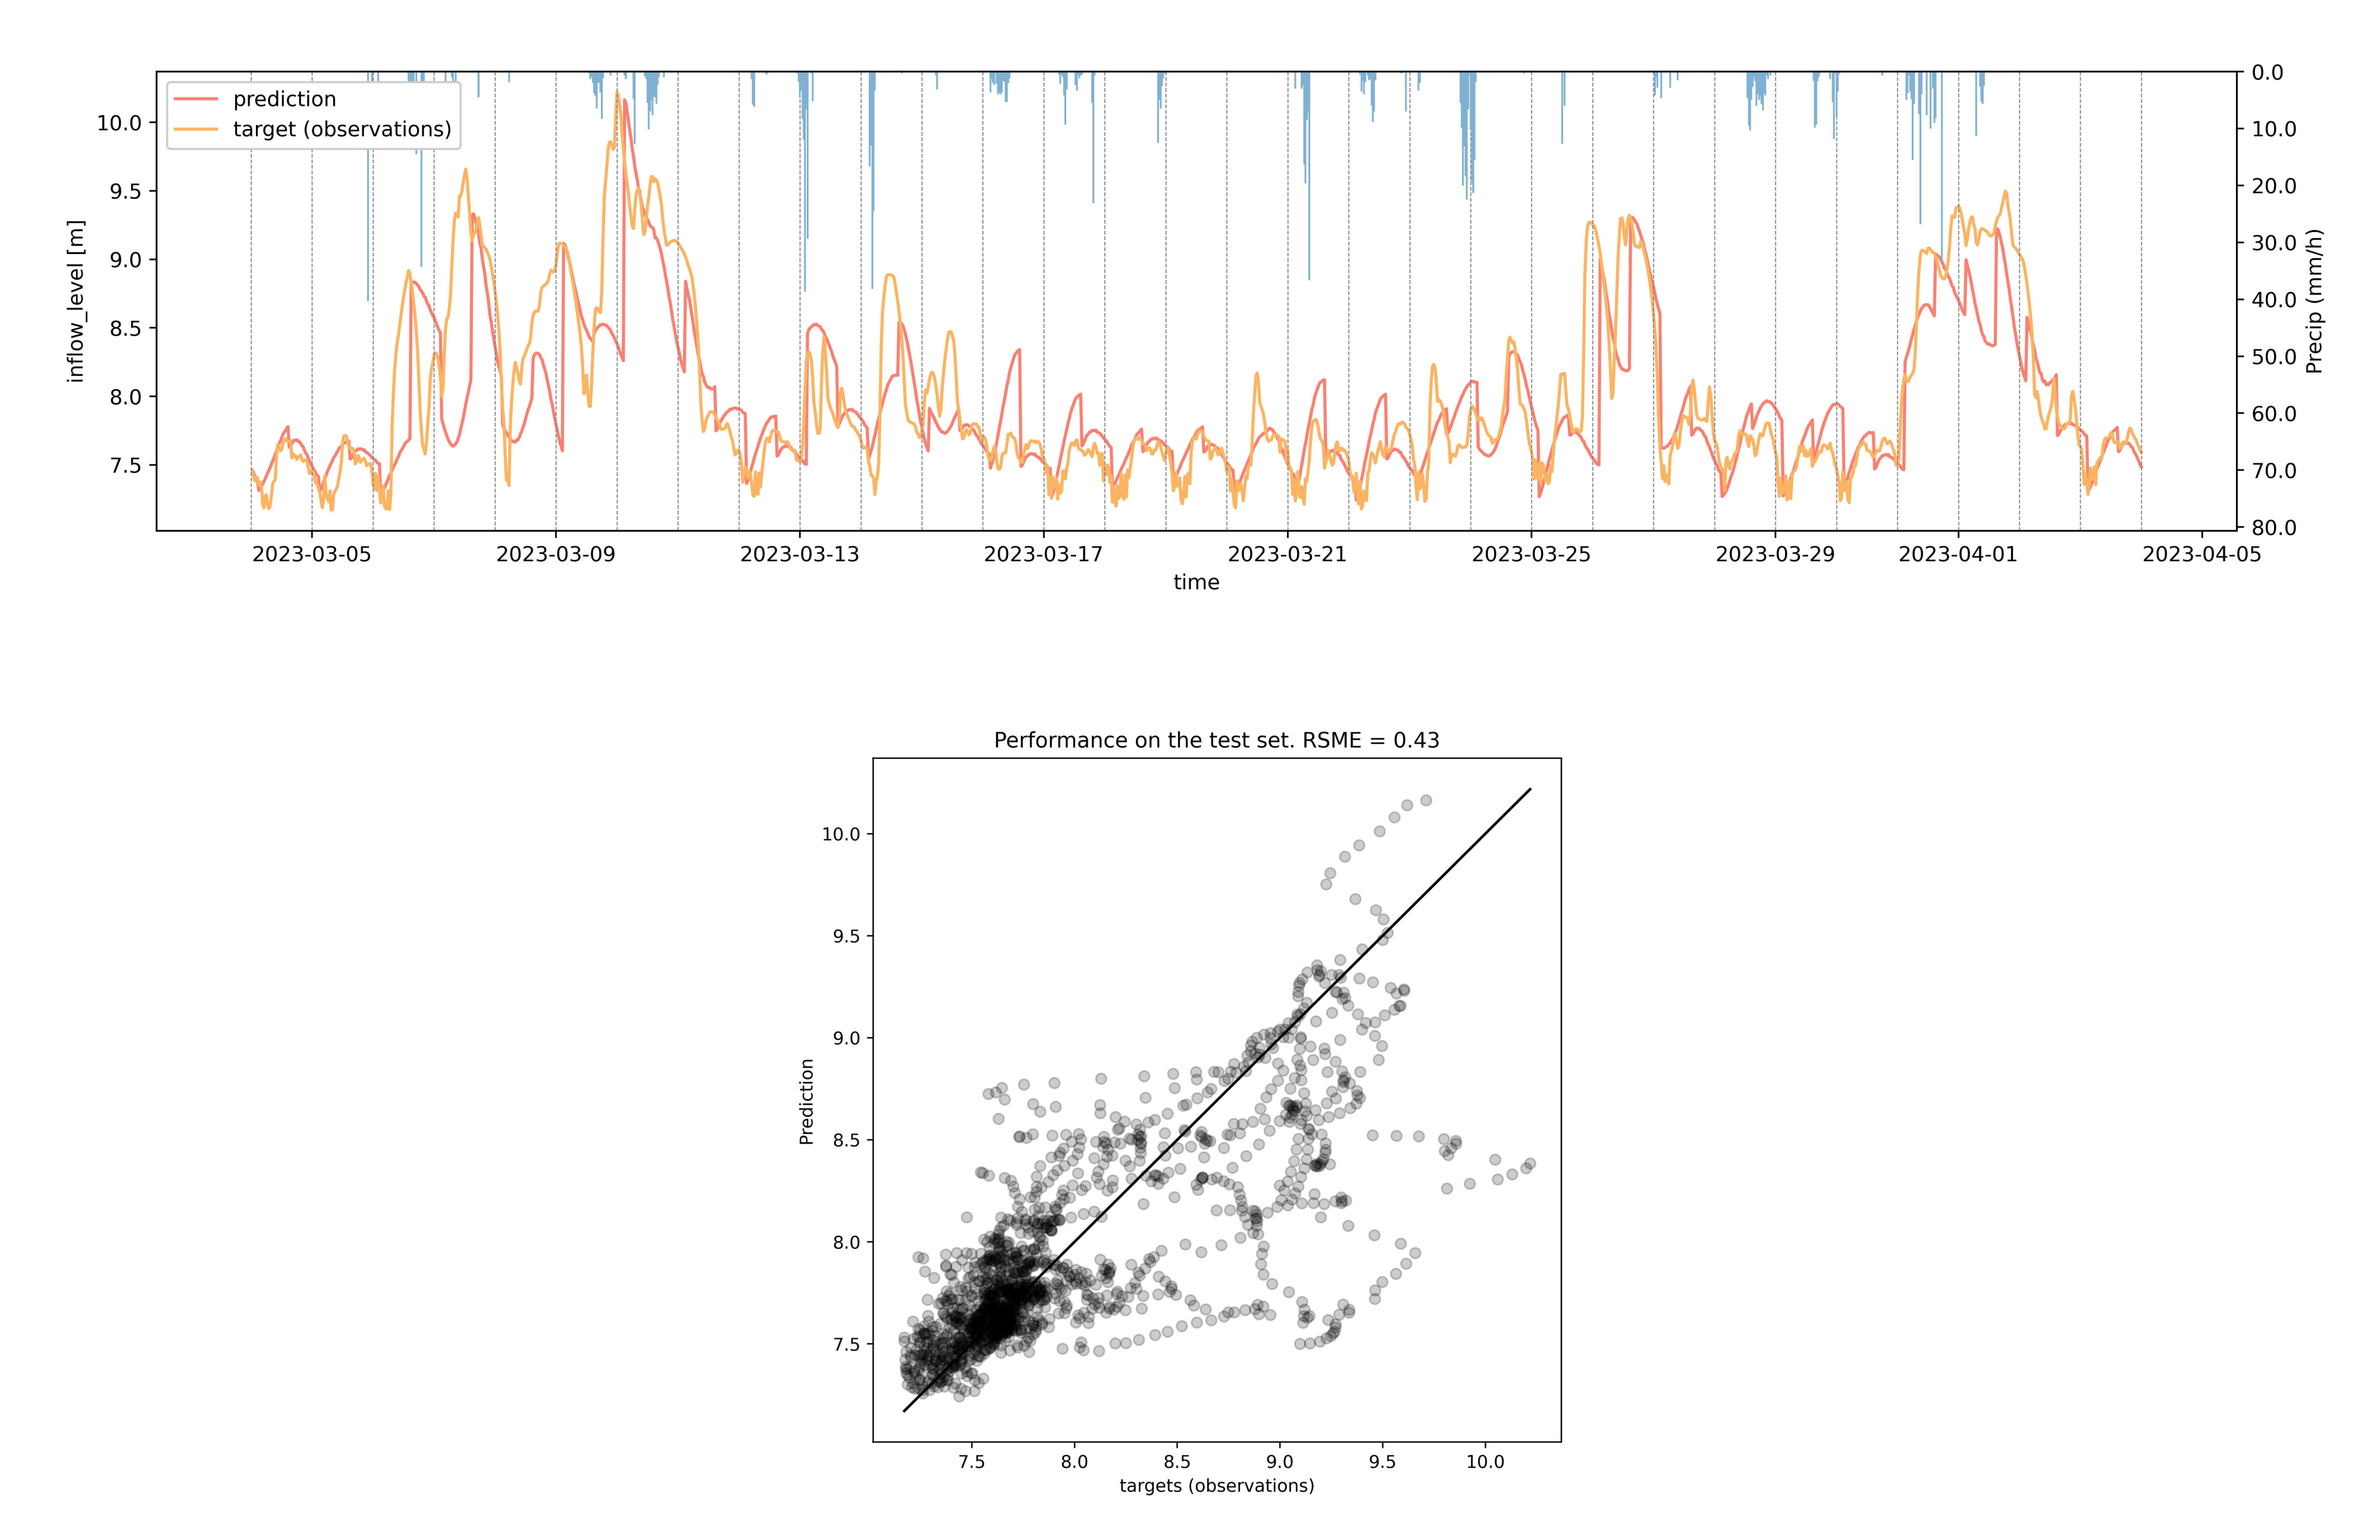
Figure 3 shows the results of the influent prediction. On the top a good fit between observed and modelled influent levels can be seen. On the bottom image, a 1:1 plot of all observations and predictions is shown. Some events are not yet captured fully, or our model sometimes predicts a peak in influent, while in reality this wasn’t observed. This can be explained by the option of the sewer operators to use the sewer system as a buffer for rainfall events. This is something probably not yet captured in the input data.

Figure 3: [Top] Influent level observations and predictions at the Tilburg WWTP. [Bottom] 1:1 plot of all observation and predictions.
Outlook
We have presented two data-driven machine learning models, that can help utilities make better decisions in their day-to-day operations. As shown, the models are not perfect and can be improved. For the Yser case, the most progress needs to be made. For this, several research topics are currently ongoing in the Flanders AI program. One crucial aspect is the amount of missing data in the sensor measurement timeseries. The STADIUS research group from KULeuven (prof. Johan Suykens & Sonny Achten) is looking into Kernel Principal Component Analysis (KPCA) to do data imputation and solve the gaps in the dataset. The KERMIT research group from Ugent (prof. Jan Verwaeren & Alessandro Barbini) is looking at training combined machine learning and decision loops, where the end goal is to optimise the decision, and the machine learning model weights are tuned to the decision, and not the prediction itself.
For the Tilburg case, predictions are looking already rather solid, and advances can be made to see how decisions can be optimized. This is taken up in the Horizon Europe project DARROW, where VITO is also a partner.
With all these advances in place, our water team at VITO is making steps to strengthen our water economy in Flanders, so that we can fully benefit from this golden era!
